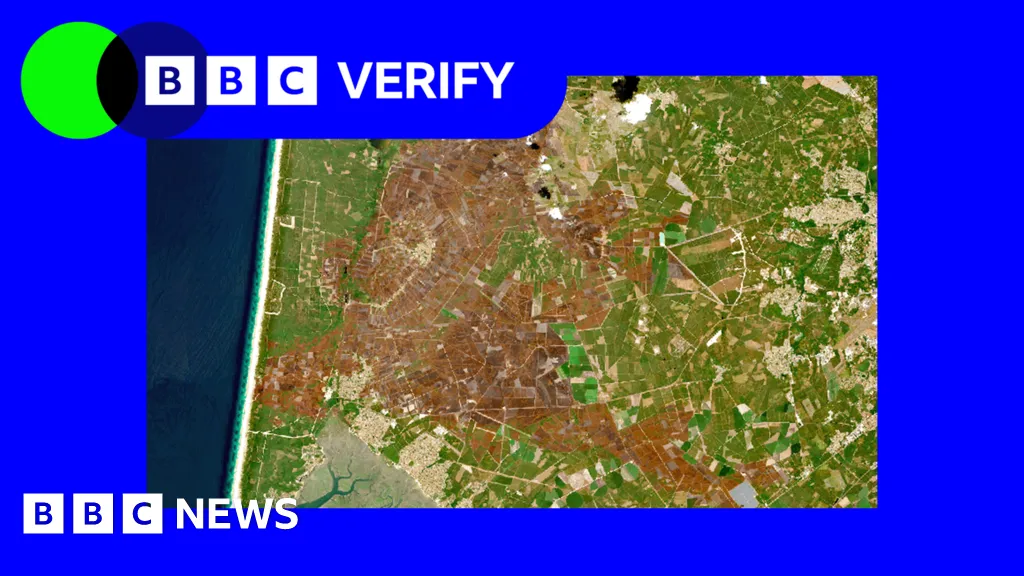
The impact of this summer's extreme temperatures on Europe" class="entity-link entity-location" data-entity-id="18280" data-entity-type="location">Western Europe can now be seen from space after successive Heatwaves since May.Satellite images examined by BBC Verify show shrunken glaciers, scorched areas left by Wildfires, green fields turned arid and lower river levels.And some landmarks have been affected, too. The Palace of Versailles, south of the French capital Paris, appears as an island of trees surrounded by brown fields in these images.The EU's climate monitoring service, Copernicus, has confirmed that Europe" class="entity-link entity-location" data-entity-id="18280" data-entity-type="location">Western Europe experienced its hottest June-to-July period on record.The immediate cause of the Heatwaves has been persistent high-pressure weather systems bringing clear, sunny skies and allowing temperatures to build, according to the Met Office.But Climate Change, mainly due to the burning of Fossil Fuels, has been raising average temperatures for decades and making hot spells much more likely and intense.We've taken a look at how the sweltering weather has left its mark on landscapes across the continent.
SRCBBC News - World
LANGEN
LEANCenter
WORDS156
ENT11
SAT · 2026-08-15 · 05:01 GMTBRIEF NSR-2026-0815-102509
NSR-2026-0815-102509News Report·EN·Environmental
Europe's scorched landscapes seen from space after summer heatwaves
Satellite images examined by BBC Verify reveal the widespread impact of this summer's extreme heatwaves and drought on western Europe. Since May, successive heatwaves have caused visible changes to the landscape, including shrunken glaciers, areas scorched by wildfires, arid fields, and significantly lower river levels.
1 hour agoBBC News - WorldFiled 2026-08-15 · 05:01 GMTLean · CenterRead · 1 min
BBC News - WorldFIG 01
Reading time
1min
Word count
156words
Sources cited
2cited
Entities identified
11entities
Quality score
100%
§ 01
Briefing Summary
AI-generatedNEWSAR · AI
Satellite images examined by BBC Verify reveal the widespread impact of this summer's extreme heatwaves and drought on western Europe. Since May, successive heatwaves have caused visible changes to the landscape, including shrunken glaciers, areas scorched by wildfires, arid fields, and significantly lower river levels. The EU's Copernicus climate monitoring service confirmed that the June-to-July period was the hottest on record for western Europe. While persistent high-pressure systems were the immediate cause of the heatwaves, climate change, largely driven by fossil fuel burning, has increased the likelihood and intensity of such hot spells over decades.
Confidence 0.90Sources 2Claims 5Entities 11
§ 02
Article analysis
Model · rule-basedFraming
Environmental
Human Interest
Tone
Measured
AI-assessed
CalmNeutralAlarmist
Factuality
0.80 / 1.00
Factual
LowHigh
Sources cited
2
Limited
FewMany
§ 03
Key claims
5 extracted01
Climate change, primarily from burning fossil fuels, has increased average temperatures and made heatwaves more likely and intense.
factual
Confidence
1.00
02
Persistent high-pressure weather systems caused the heatwaves by bringing clear skies and allowing temperatures to build.
factualMet Office
Confidence
1.00
03
Western Europe experienced its hottest June-to-July period on record.
statisticCopernicus (EU's climate monitoring service)
Confidence
1.00
04
The Palace of Versailles appears as an island of trees surrounded by brown fields in satellite images.
factualBBC Verify
Confidence
1.00
05
Satellite images show the impact of summer heatwaves on western Europe, including shrunken glaciers, scorched areas, arid fields, and lower river levels.
factualBBC Verify
Confidence
1.00
§ 04
Full report
1 min read · 156 words§ 05
Entities
11 identifiedKey playerOppositionContextPositiveNeutralNegative
Organizations4
Locations4
Events1
§ 06
Keywords & salience
9 termsclimate change
1.00
heatwaves
1.00
scorched landscapes
0.90
satellite images
0.80
extreme temperatures
0.70
western europe
0.60
fossil fuels
0.50
river levels
0.40
copernicus
0.40
§ 07
Topic connections
Interactive graph Network visualization showing 51 related topics
View Full Graph Person Organization Location Event|Click node to navigate|Edge numbers = shared articles