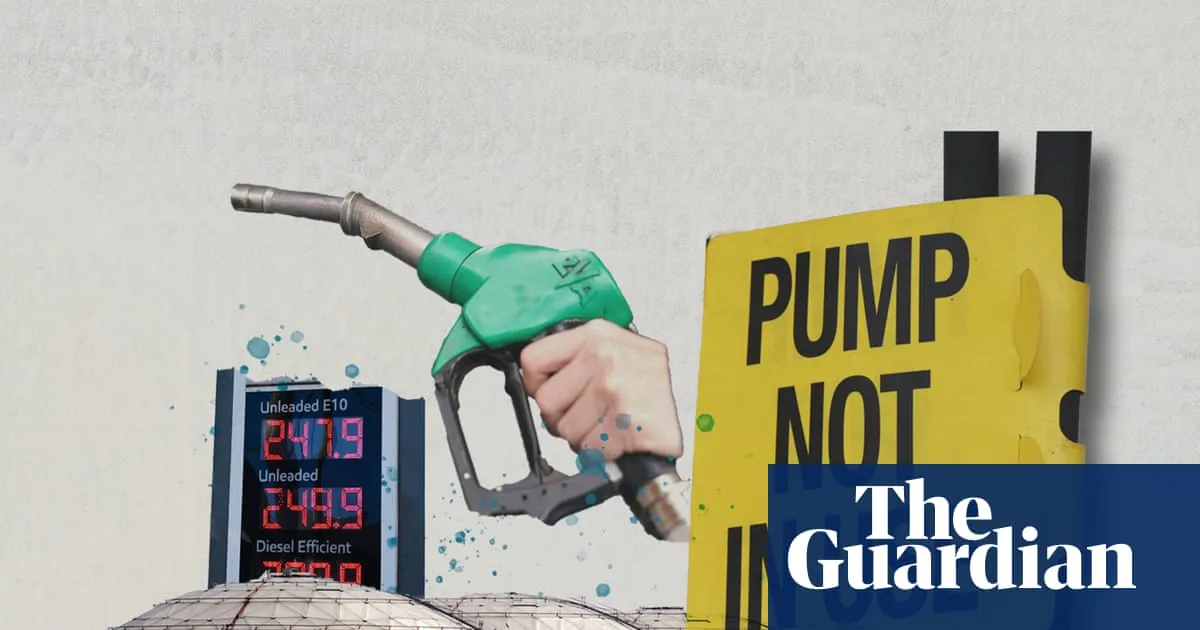
Use our fuel tracker to check petrol and diesel prices, a map of how many service stations have run out of fuel and how long our reserve supplies will last. Australia’s fuel crisis in data and charts. Composite: AAP/ Guardian Australia View image in fullscreen Use our fuel tracker to check petrol and diesel prices, a map of how many service stations have run out of fuel and how long our reserve supplies will last. Australia’s fuel crisis in data and charts. Composite: AAP/ Guardian Australia Explainer Track Australia’s fuel prices, service station outages and shipments in charts How much fuel does Australia have left today, and when could we run out? Track how much petrol and diesel prices have risen near you in Sydney, Melbourne and across the country. Get our breaking news email, free app or daily news podcast The Federal Government has released fuel reserves, cut fuel excise taxes and rolled out a national fuel security plan as Australia battles a fuel crisis. While we know there have been outages and price increases, it can be difficult to get a full picture of what is happening – this is partly due to the thousands of independent businesses and different governments involved. We have brought together the latest data on prices, outages and oil tanker deliveries. Looking at the averages for petrol and diesel across Australia, we can see how much prices have risen since the US and Israel’s war on Iran began in late February. There can be a huge variation in price and availability, even across a relatively small area. Fuel outages aren’t static – stations can run out and regain stock as governments and companies race to fill gaps in supply chains and release more fuel. The map below shows the number of fuel outages across Australia, day by day. You can hover over the stations for a macro view, and click through the dates where data is available. Since we began collecting data on 27 March, you can see a spike in outages in New South Wales and Victoria on 30 and 31 March. The next chart shows the total number of stations out of at least one kind of fuel on each day. This is an estimate and may be an undercount given the different timescales that each state reports data. At least six fuel shipments to Australia have already been cancelled or deferred, and experts say there will probably be more delays or cancellations. The next chart shows the total number of “port calls” – or stops – at Australian ports by tankers with shipments of fuel and crude oil, which is refined to make fuel. The data does not distinguish between imports and exports, but it does show a slight decline in the number of tankers in February and March compared with the last six years. The same dataset shows a complete collapse in tankers travelling through the strait of Hormuz in the first weeks of March. Before the war, about a fifth of global oil and a third of fertilisers were shipped through the strait. Early in March the Federal Government cut the minimum stock levels that fuel companies are required to hold for emergencies. The next chart is a weekly snapshot of fuel reserves compared to the new minimums, and how long this would last at normal consumption rates. As of the beginning of April, Australia’s fuel reserves – measured in the number of days they would last – had actually increased since prewar levels. Data is sourced from government fuel websites and apis on a daily basis. Average petrol, e10 and diesel prices are sourced from Motormouth once a day. Some government fuel data is live, while some is refreshed on a delay or when stations change prices – all displayed dates are when the data is retrieved. Victoria, Queensland, South Australia and the Northern Territory explicitly indicate in their data whether fuel is available. Outages for NSW and Tasmania are estimated based on the types of fuels each station tends to carry compared to what is available. Outages for Western Australia are based on temporary outage dates for each station. WA data for 26 to 30 March has been extracted from historic Fuelwatch data, with outages estimated in the same way as NSW and Tasmania. Daily total outage counts are based on the sum of all the data displayed for each date in the map. Tanker data is sourced from Portwatch from the University of Oxford, using data from the IMF. Counts are port visits by tanker ships, which could be either imports or exports. Tanker data is sourced on a daily basis but is not updated every day. Explore more on these topics Petrol prices Oil US-Israel war on Iran Commodities International trade explainers Share Reuse this content
SRCThe Guardian - World News
LANGEN
LEANCenter-Left
WORDS802
ENT8
THU · 2026-04-16 · 00:28 GMTBRIEF NSR-2026-0416-69859
NSR-2026-0416-69859News Report·EN·Economic Impact
Australia fuel watch tracker: check current petrol and diesel prices, service station outages and shipments – in charts
Australia is facing a fuel crisis marked by rising prices, service station outages, and potential supply chain disruptions. A fuel tracker has been created to monitor petrol and diesel prices across the country, particularly in major cities like Sydney and Melbourne.
Josh Nicholas and Andy BallThe Guardian - World NewsFiled 2026-04-16 · 00:28 GMTLean · Center-LeftRead · 4 min
The Guardian - World NewsFIG 01
Reading time
4min
Word count
802words
Sources cited
2cited
Entities identified
8entities
Quality score
100%
§ 01
Briefing Summary
AI-generatedNEWSAR · AI
Australia is facing a fuel crisis marked by rising prices, service station outages, and potential supply chain disruptions. A fuel tracker has been created to monitor petrol and diesel prices across the country, particularly in major cities like Sydney and Melbourne. The tracker also maps fuel outages at service stations and estimates the nation's remaining fuel reserves. Data indicates a price surge since late February and spikes in outages, especially in New South Wales and Victoria around March 30-31. The crisis is further complicated by cancelled or deferred fuel shipments to Australia, raising concerns about long-term supply. The federal government has responded with measures like releasing fuel reserves and cutting fuel excise taxes.
Confidence 0.90Sources 2Claims 5Entities 8
§ 02
Article analysis
Model · rule-basedFraming
Economic Impact
Tone
Measured
AI-assessed
CalmNeutralAlarmist
Factuality
0.70 / 1.00
Factual
LowHigh
Sources cited
2
Limited
FewMany
§ 03
Key claims
5 extracted01
About a fifth of global oil and a third of fertilisers were shipped through the strait of Hormuz in the past, but has since collapsed
statisticArticle's own claim
Confidence
1.00
02
The federal government has released fuel reserves, cut fuel excise taxes and rolled out a national fuel security plan as Australia battles a fuel crisis
factualArticle's own claim
Confidence
1.00
03
Since we began collecting data on 27 March, you can see a spike in outages in New South Wales and Victoria on 30 and 31 March
statisticArticle's own claim
Confidence
1.00
04
The map shows the number of fuel outages across Australia, day by day
statisticArticle's own claim
Confidence
1.00
05
At least six fuel shipments to Australia have already been cancelled or deferred
factualArticle's own claim
Confidence
1.00
§ 04
Full report
4 min read · 802 words§ 05
Entities
8 identifiedKey playerOppositionContextPositiveNeutralNegative
Organizations1
§ 06
Keywords & salience
10 termsfuel prices
1.00
fuel outages
0.90
fuel supply
0.80
fuel crisis
0.80
petrol
0.70
diesel
0.70
fuel shipments
0.60
fuel reserves
0.60
australia
0.50
oil tanker deliveries
0.40
§ 07
Topic connections
Interactive graph Network visualization showing 51 related topics
View Full Graph Person Organization Location Event|Click node to navigate|Edge numbers = shared articles